Men’s Final 8
Quarter-final 2: Calgary holds on for 78-76 win over Brock
The 2018 U SPORTS Men’s Basketball Final 8 Championship is poised to tip off this weekend, with a record-breaking eighth consecutive championship on the line for the Carleton Ravens. There is no doubt that this is a Canadian basketball dynasty – the Ravens have claimed 13 of the last 15 national championships, and have a current regular season win streak of 48 (their last loss was Feb. 5, 2016). While Carleton holds a renowned reputation in U SPORTS, the question begs to be asked: how does a team like Carleton compare to our southern counterparts - the NCAA?
Carleton is no stranger to cross-border matchups. During the pre-season in their seven-year championship run, the Ravens have played 54 exhibition games against Division I NCAA schools. During this time, the Ravens posted wins against perennial NCAA powerhouse programs such as Wichita State, Baylor and Wisconsin. Through these north vs. south competitions, Carleton established a winning record of 30-24, averaging 75.5 points per game and a point differential of +5.2. It’s evident that Carleton puts up a strong game when competing against these high-level teams, but how do they do it? Curious to see how Carleton matches up against teams in the NCAA, we have put together a head-to-head statistical comparison.
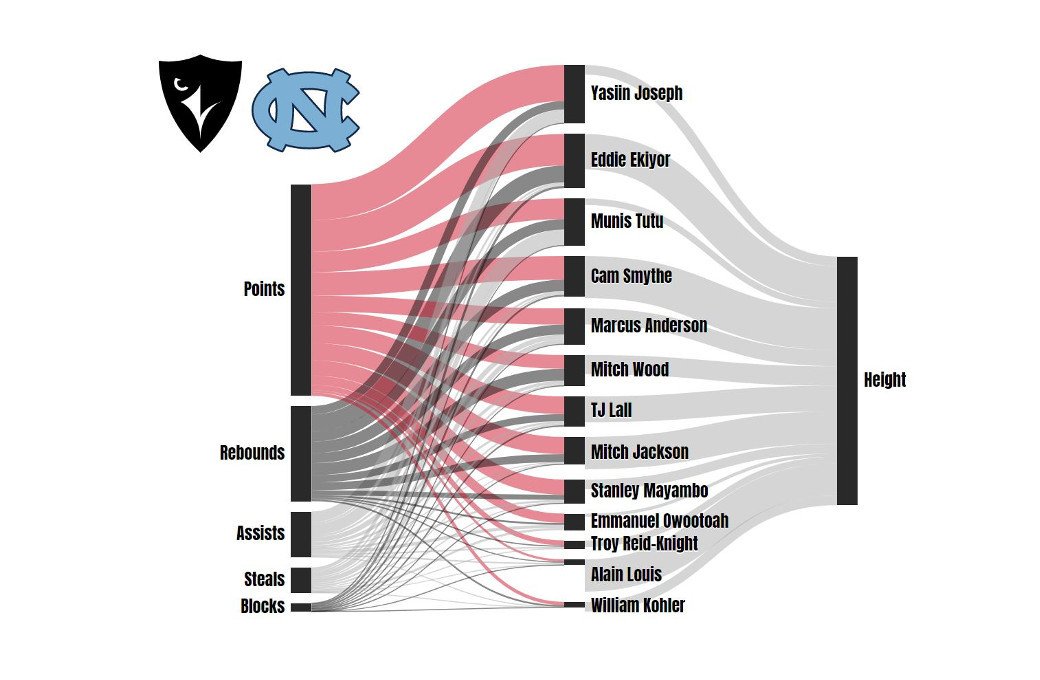
Click on the picture below to see an interactive visualization comparing this year’s Carleton squad to the 2017 NCAA Div. I winner, University of North Carolina (UNC). It’s a season overview of standard statistics – points, rebounds, assists, steals and blocks. These statistics are compared both relative to each other as well as on an individual basis. To use the interactive chart, hover your mouse over each statistic, view each stat on its own by hovering over the bar beside the stat, or click on the team logo in the top left corner to see the other team.
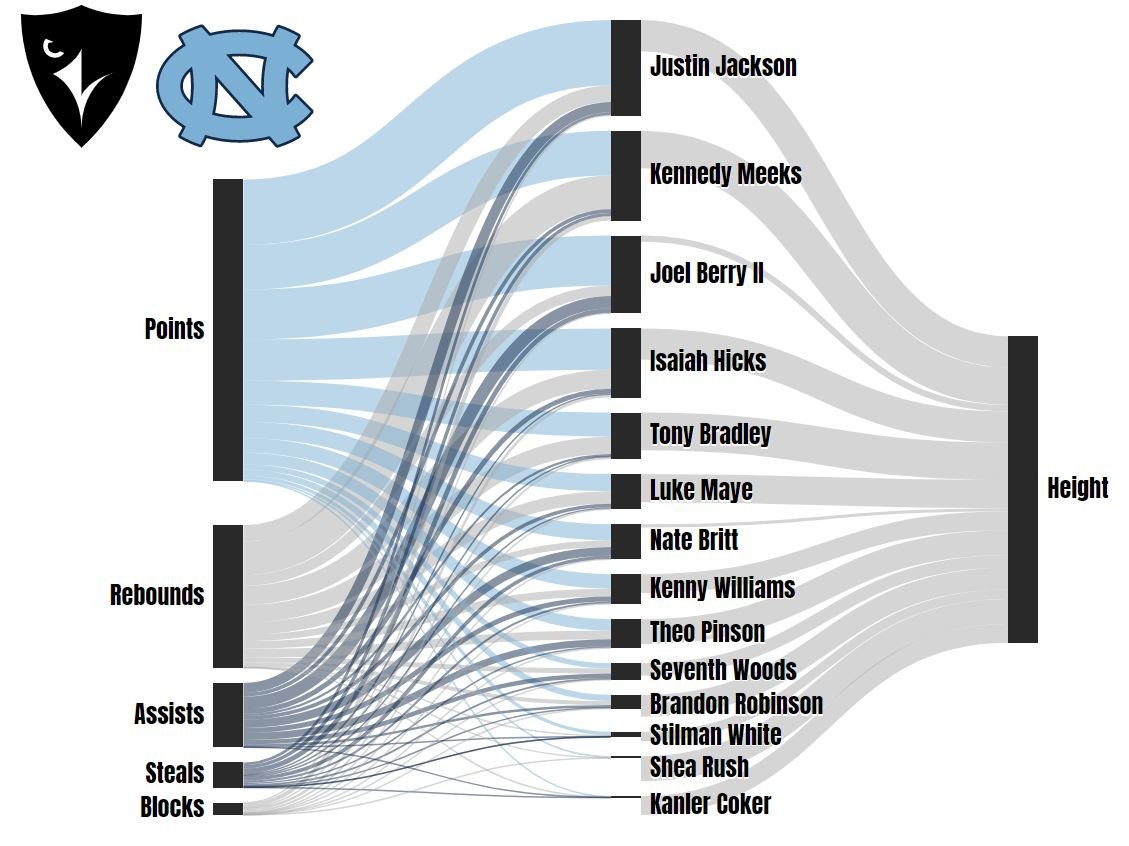
Another option for comparison is to examine the traditional counting statistics – points, rebounds, assists, blocks and steals of both teams. This is done per game : Carleton played only 26 regular season and playoff games heading into the Final 8 this weekend, while UNC finished 40 last year.
| Team | PPG | REB/G | AST/G | STL/G | BLK/G |
| Carleton | 88.5 | 42.0 | 19.1 | 10.5 | 3.6 |
| UNC | 84.4 | 43.7 | 18.1 | 7.1 | 3.5 |
This serves its purpose by showing Carleton is putting up significant numbers in all major categories, but is not a very meaningful metric, partly because it doesn’t take pace into account.
Pace describes the number of possessions a team has during a game. Teams play at varying paces - a team with a higher pace (more possessions in a game) has a better chance of scoring more points, therefore inflating their “per-game” statistics. For example, Carleton averaged 76.4 possessions per game this season, while last year North Carolina averaged 72.8 possessions per game. The following metrics try and correct for this by comparing using possessions or statistics relative to each other.
More information on the calculation of the statistics
Even more statistics
| Team | DRtg | ORtg | eFG% | TOV% | ORB% | DRB% | FTF |
| Carleton | 79.4 | 115.7 | 0.542 | 13.6 | 40.8 | 76.5 | 0.196 |
| UNC | 97.0 | 116.0 | 0.519 | 13.4 | 41.3 | 75.5 | 0.244 |
UNC had a better ORB% than Carleton, but it was the best in the entire NCAA that year – Carleton would have been second with a 40.8. The comparisons are more balanced overall except for DRtg. Carleton's opponents managed a measly 79.4 points per 100 possessions – a stat that would easily top the NCAA in that category. This suggests the possibility that Carleton played considerably weaker teams, thus the superior statistics. One way to try to correct for this is to determine how U SPORTS players would fare in the NCAA.
There are two well-documented cases of U SPORTS players transferring to NCAA Div. I programs. Dejan Kravic started with the York Lions, then played two seasons at Texas Tech. Isiah Osborne suited up for the Winsor Lancers, and this season is playing for the University of Texas at El Paso (UTEP). The graphic below compares their seasons before and after the transfer. Again, the statistic used for comparison is Offensive Rating – related to points per 100 possessions. 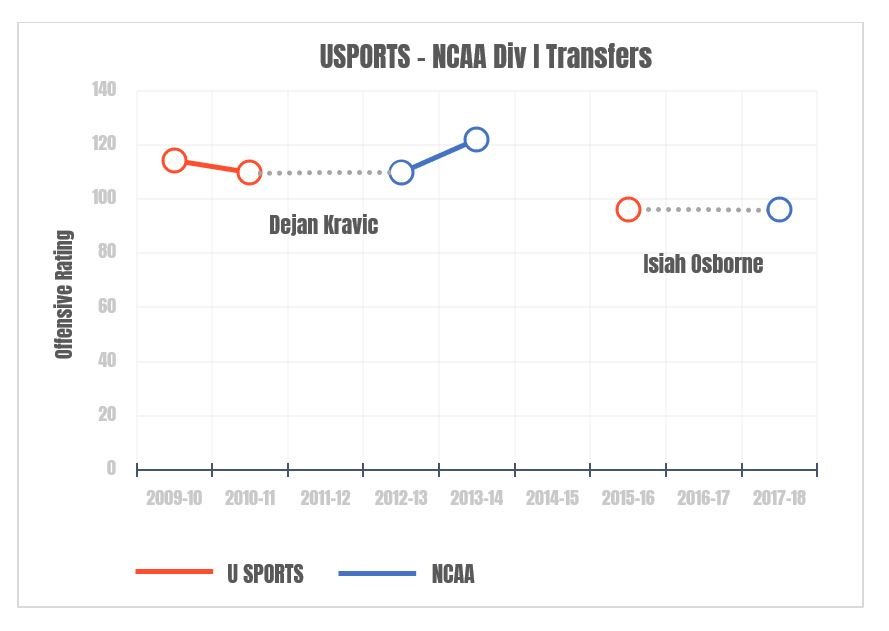
Transfers to the NCAA end up averaging about the same amount of points per possession as in U SPORTS, after they sit out their required year. Perhaps this allows them to adjust to the different rule changes – U SPORTS competes under FIBA rules, while NCAA has their own rules.
The sample size is small, but it does indicate that U SPORTS players can be just as competitive in the NCAA.
The research shows that Carleton could be competitive with a top-ranked NCAA team. They have the roster, they're putting up the numbers, and individual players have made it work down south.
Watch the U SPORTS Men’s Basketball Final 8 championships this weekend on USPORTS.LIVE and Sportsnet 360/SportsnetNOW.
Get your tickets here.

Liam is the current Web and Statistics Intern at U SPORTS.
Instagram: @liamkopp
Men’s Final 8